
Tropospheric NO2 columns retrieved from satellite instruments are useful to infer NOx pollution, NOx emissions and atmospheric chemistry. Current satellite products are subject to limitations in assumptions of aerosol optical effects, surface reflectance anisotropy, vertical profiles of NO2, and cloud optical properties.
Here we develop an improved Peking University Ozone Monitoring Instrument NO2 product (POMINO-OMI) for Asia. Currently, there are three versions available: POMINO-OMI v1, POMINO-OMI v2 and POMINO-OMI v2.1. We highly recommend to use latest POMINO-OMI v2.1 dataset for researches.
Algorithm
POMINO-OMI v1 (Lin et al., 2014; Lin et al., 2015):
This is the original "POMINO" algorithm.
POMINO v1 explicitly accounts for aerosol optical effects, angular dependence of surface reflectance, and dynamically varying atmospheric profiles of air pressure, air temperature and NO2 at a high horizontal resolution (25-50 km). The daily AOD data are simulated by nested GEOS-Chem and further constrained by MODIS (C5.1) data on a monthly basis. The daily BRDF data are from MCD43C2 (C5.1).
Prior to the NO2 retrieval, we retrieve cloud top pressure and cloud fraction using consistent assumptions about the states of the atmosphere and surface.
For our NO2 and cloud retrievals, we adopt from KNMI (via www.temis.nl) the SCDs of tropospheric NO2 (DOMINO v2) and O2-O2 dimer (OMCLDO2 v1.1.1.3), the TOA reflectance, and some other ancillary information.
We develop the AMFv6 code for air mass factor calculation, based on the radiative transfer model LIDORT v3.6. The AMFv6 code improves upon the code developed by Paul Palmer, Randall Martin et al., with various aforementioned capability added/extended to accommodate the calculation here. With AMFv6, radiative transfer is calculated explicitly for each satellite pixel with no need to use a look-up table. The calculation of AMFv6 is parallelized and is sufficiently fast so that one day of retrieval with global coverage would only take about three hours using 16 CPU cores.
POMINO-OMI v2 (Liu et al., 2019):
On top of POMINO v1, POMINO v2 further constrains the vertical profile of aerosol extinction by monthly climatology from CALIOP, uses the SCD data from QA4ECV, and updates to MODIS (C6) merged AOD and MCD43C2 (C6) daily BRDF.
POMINO-OMI v2.1 (Zhang et al., 2022):
Based on POMINO-OMI v2, POMINO-OMI v2.1 fixed the bug of supplementary angle of RAA which is incorrectly used before, expands the spatial domain to East Asia, much of Southeast Asia and most of South Asia (70 – 140°E, 15 – 55°N), directly uses the valid pixels and corner's latitude/longitude information from QA4ECV for NO2 retrieval, and updates the ancillary parameters used in NO2 retrieval.
Validation
The POMINO v1 product is consistent with MAX-DOAS NO2 data in China, with a R^2 of 0.96 as compared to the value at 0.72 for DOMINO v2. The improved consistency is related to explicit pixel-by-pixel radiative transfer calculation (instead of using a look-up table), consistent treatments of all parameters in retrieving clouds and NO2, explicit consideration of aerosol optical effects (rather than adjusting ‘effective’ clouds to implicitly account for aerosols), and consideration of surface reflectance anisotropy.
The POMINO v1 product is able to capture the high pollution situations (e.g., high aerosol and NO2 concentrations), in addition to the modest and low population situations.
The POMINO v2 product further reduces the bias against MAX-DOAS data, while maintaining the high correlation.
AMFv6 Code
Our AMFv6 code is available for public use. Currently, AMFv6 also allows users to (some of them may need further customization):
This is the original "POMINO" product. Data are available from 2004 through 2016.
Level-3 data
POMINO-OMI Monthly or Daily Level-3 Data Download (OneDrive) (Global user)
POMINO-OMI Monthly or Daily Level-3 Data Download (Quark) (China-based user)
Both daily and monthly Level-3 NO2 tropospheric VCD products are on a 0.25 x 0.25 degree grid, spatially aggregated from the Level-2 data.
Included in the Level-3 data are tropospheric NO2 AMF, tropospheric NO2 VCD, AOD at 550 nm, SSA at 550 nm, and other ancillary parameters.
The file "readme_POMINO_level3.txt" in the link above provides an introduction, including example reading programs in IDL and Fortran.
Level-2 data
POMINO-OMI Level-2 Data Download (OneDrive) (Global user)
POMINO-OMI Level-2 Data Download (Quark) (China-based user)
Included are pixel-specific NO2 tropospheric VCD product and ancillary data.
Each tar.gz file contains a month worth of data files. Each data file contains Level-2 data for tropospheric NO2 AMF, tropospheric NO2 VCD, AOD at 550 nm, SSA at 550 nm, and other ancillary parameters.
The file "readme_POMINO_level2.txt" in the link above provides an introduction, including example reading programs in IDL and Fortran.
This product is added on 2020/09/01. Data are available from January 2004 to June 2020.
Level-3 data
POMINO-OMI v2 Monthly or Daily Level-3 Data Download (OneDrive) (Global user)
POMINO-OMI v2 Monthly or Daily Level-3 Data Download (Quark) (China-based user)
Both daily and monthly Level-3 NO2 tropospheric VCD products are on a 0.25 x 0.25 degree grid, spatially aggregated from the Level-2 data.
Included in the Level-3 data are tropospheric NO2 AMF, tropospheric NO2 VCD, AOD at 550 nm, SSA at 550 nm, and other ancillary parameters.
See user guide for brief documentation of the variables included (NO2 VCD, AMF, AOD, SSA, etc.), as well as how to read the Level-3 data.
Level-2 data
POMINO-OMI v2 Level-2 Data Download (OneDrive) (Global user)
POMINO-OMI v2 Level-2 Data Download (Quark) (China-based user)
See user guide for brief documentation of the variables included (NO2 VCD, AMF, AOD, SSA, etc.).
Examples to read the Level-2 data in IDL and Fortran are provided in the link above.
This product is added on 2021/10/28. Data are available from May 2012 to March 2021.
POMINO v2.1 monthly mean NO2 VCD maps in 2020/1-4-7-10/ (0.25 x 0.25 degree):

Level-3 data
POMINO-OMI v2.1 Monthly or Daily Level-3 Data Download (OneDrive) (Global user)
POMINO-OMI v2.1 Monthly or Daily Level-3 Data Download (Quark) (China-based user)
Both daily and monthly Level-3 NO2 tropospheric VCD products are on a 0.25 x 0.25 degree grid, spatially aggregated from the Level-2 data.
Included in the Level-3 data are tropospheric NO2 AMF, tropospheric NO2 VCD, AOD at 550 nm, SSA at 550 nm, and other ancillary parameters.
See user guide for brief documentation of the variables included (NO2 VCD, AMF, AOD, SSA, etc.), as well as how to read the Level-3 data.
Level-2 data
POMINO-OMI v2.1 Level-2 Data Download (OneDrive) (Global user)
POMINO-OMI v2.1 Level-2 Data Download (Quark) (China-based user)
See user guide for brief documentation of the variables included (NO2 VCD, AMF, AOD, SSA, etc.).
Examples to read the Level-2 data in IDL and Fortran are provided in the link above.
References
Lin, J.-T. *, R. V. Martin, K. F. Boersma, M. Sneep, P. Stammes, R. Spurr, P. Wang, M. Van Roozendael, K. Clémer, and H. Irie: Retrieving tropospheric nitrogen dioxide from the Ozone Monitoring Instrument: Effects of aerosols, surface reflectance anisotropy, and vertical profile of nitrogen dioxide, Atmos. Chem. Phys., 14, 1441-1461, doi:10.5194/acp-14-1441-2014, 2014 (PDF) (Original algorithm: proof of concept)
Lin, J.-T. *, Liu, M.-Y., Xin, J.-Y., Boersma, K. F., Spurr, R., Martin, R., and Zhang, Q.: Influence of aerosols and surface reflectance on satellite NO2 retrieval: seasonal and spatial characteristics and implications for NOx emission constraints, Atmospheric Chemistry and Physics, 15, 11217-11241, doi:10.5194/acp-15-11217-2015, 2015 (PDF) (Supplement) (Original algorithm and POMINO v1 product)
Liu, M.-Y., Lin, J.-T. * , Boersma, K. F. *, Pinardi, G., Wang, Y., Chimot, J., Wagner, T., Xie, P., Eskes, H., Van Roozendael, M., Hendrick, F., Wang, P., Wang, T., Yan, Y.-Y., Chen, L.-L., and Ni, R.-J.: Improved aerosol correction for OMI tropospheric NO2 retrieval over East Asia: constraint from CALIOP aerosol vertical profile, Atmospheric Measurement Techniques, 12, 1-21, doi:10.5194/amt-12-1-2019, 2019 (PDF) (Updated algorithm and POMINO v1.1 and v2 products)
Zhang, Y.-H., Lin, J.-T. *, Liu, M.-Y., Kong, H., Chen, L.-L., Weng, H.-J., and Li, C.-J.: High-resolution tropospheric NO2 Retrieval over Asia based on OMI POMINO v2.1 and quantitative comparison with other products (in Chinese), National Remote Sensing Bulletin, 26, 971-987, doi:10.11834/jrs.20221413, 2022 (PDF)(Supplement)
Introduction
The POMINO-TROPOMI product is retrieved from the Tropospheric Monitoring Instrument (TROPOMI) launched on October 13th 2017. The retrieval domain is 70°-140°E, 15°-55°N. Currently, there are two versions available: POMINO-TROPOMI v1 and POMINO-TROPMI v1.2. We highly recommend to use latest POMINO-TROPOMI v1.2 dataset for researches.
TROPOMI is a UV/Visible/Near-Infrared/Short-wave infrared backscattering sensor onboard the sun-synchronous Sentinel-5 Precursor (S5P) satellite with an overpass time of 13:30 local solar time. Since 6 August 2019 (orbit 9388), the S5P operation scenario increases the spatial resolution from 7.0 km (along track) x 3.5 km (cross track) at nadir view to 5.5 km x 3.5 km for NO2 measurements (at Visible wavelengths).
Currently, there are three versions with different available time period: POMINO-TROPOMI v1.2, POMINO-TROPMI v1.2.2 and POMINO-TROPOMI v2. Please see following recommendations for data use. We will do a full reprocess based on POMINO-TROPOMI v2 processor in the future to generate a consistent data product.
Algorithm
POMINO-TROPOMI v1 (Liu et al., 2020):
The algorithm (POMINO-TROPOMI) to retrieve tropospheric NO2 measured by TROPOMI instrument is built upon our previous algorithm (POMINO) for the Ozone Monitoring Instrument (OMI). The algorithm is based on the AMFv6 package that calls the radiative transfer model LIDORT v3.6. The algorithm differences between POMINO and POMINO-TROPOMI are mainly related to instrument issues, such as available spectral coverage and spatial resolution, and details of the cloud retrieval.
Figure 1 shows the procedure of using the AMFv6 package to derive the tropospheric NO2 VCDs in POMINO-TROPOMI. It starts from taking tropospheric slant column densities (SCDs) from the official TM5-MP-DOMINO (OFFLINE) product, and further makes improvements in the calculation of tropospheric air mass factors (AMFs). Compared to the official product, POMINO-TROPOMI explicitly accounts for the daily aerosol scattering/absorbing, explicitly considers daily surface reflectance dependence on light path geometry (BRDF), and uses a priori NO2 profiles with relatively high spatial resolution, etc.
The greatest difference between TROPOMI and OMI NO2 retrievals is on the (prerequisite) retrieval of clouds. Retrieval of cloud properties is a prerequisite for NO2 retrieval. For TROPOMI, we take the cloud pressure (CP) data from the FRESCO-S cloud product (van Geffen et al., 2019), which is retrieved based on O2 A-band (around 758 nm). We re-calculate the effective cloud fraction (CF) at the NO2 fitting wavelength (437.5 nm). Since the CP is retrieved by FRESCO-S without explicit aerosol corrections and BRDF effects, potential uncertainties caused by inconsistent settings may exist. This hybrid dataset for CP and CF differs from the case of OMI, for which we re-calculate CP and CF based on the O2-O2 algorithm.
The detailed discussion of our algorithm, including a comparison with the official product algorithm, can be found in Liu et al. (2020).

Figure 1. Flowchart of the POMINO-TROPOMI algorithm. The grey rectangles represent the parameters from the TM5-MP-DOMINO (OFFLINE) product.
POMINO-TROPOMI v1.2 :
Based on POMINO-TROPOMI v1, POMINO-TROPOMI v1.2 uses the updated tropospheric NO2 SCDs from S5P-PAL product and cloud pressure (CP) data from the FRESCO-wide cloud product (Van Geffen et al., 2022), and interpolates the daily NO2, pressure, temperature and aerosol profiles into 2.5km for NO2 retrieval.
POMINO-TROPOMI v1.2.2:
Based on POMINO-TROPOMI v1.2, POMINO-TROPOMI v1.2.2 fixes a small bug in BRDF coefficient interpolation process.
POMINO-TROPOMI v2 :
POMINO-TROPOMI v2 is an updated version of v1.2.2, in which we made significant improvements to the retrieval algorithm as follows:
1. We calculate optical depth (OD) vertical profiles of sulfate-nitrate-ammonia (SNA), black carbon (BC), organic carbon (OC), dust and sea salt aerosols using volume mixing ratio profiles provided by NASA Global Earth Observing System Composition Forecast (GEOS-CF) dataset (https://portal.nccs.nasa.gov/datashare/gmao/geos-cf/), and aerosol optical properties from Hi_Spectral_Res_Files.v9-02 from GEOS-Chem wiki page (http://wiki.seas.harvard.edu/geos-chem/index.php/Main_Page).
2. We also take other ancillary parameters including surface pressure, tropopause, temperature profile, relative humidity profile and a priori NO2 profiles from GEOS-CF dataset for tropospheric NO2 AMF calculation.
Compared with POMINO-TROPOMI v1.2.2, POMINO-TROPOMI v2 tropospheric NO2 VCDs are higher by 30% on average and up to 60% over polluted regions in July 2022. These differences are dominated by different a priori NO2 vertical profiles between GEOS-Chem v9-02 and GEOS-CF (with GEOS-Chem v12.0.1 chemical module) datasets. Over Eastern China, India and other polluted areas, much more NO2 molecules are concentrated near the surface in GEOS-CF dataset, resulting in smaller tropospheric NO2 AMFs and higher VCDs. Differences of tropospheric NO2 VCDs between v2 and v1.2.2 in December 2022 are within 10% on average, and reflect the mixed influences of different aerosol optical properties and a priori NO2 profiles.
Validation results with limited MAX-DOAS NO2 VCD measurements at Xianghe and Xuzhou sites and surface NO2 measurements from Ministry of Ecology and Environment (MEE) of China are supportive of the overall better performance of POMINO-TROPOMI v2 product than that of POMINO-TROPOMI v1.2.2.
Following are current data version and recommended time period for use:
POMINO-TROPOMI v1.2 (based on TROPOMI PAL v2.3.1 data): 01 May 2018 - 31 December 2020
POMINO-TROPOMI v1.2.2 (based on TROPOMI PAL v2.3.1 and TROPOMI OFFL v2.4.0 data): 01 January 2021 - 31 December 2022
POMINO-TROPOMI v2 (based on TROPOMI OFFL v2.4.0 data): 01 January 2023 - TBD
POMINO-TROPOMI v1.2 product
This product is added on 2022/10/5. Data are available from May 2018 to June 2022.
Level-3 data
POMINO-TROPOMI v1.2 Monthly or Daily Level-3 Data Download (OneDrive) (Global user)
POMINO-TROPOMI v1.2 Monthly or Daily Level-3 Data Download (Quark) (China-based user)
Both daily and monthly Level-3 NO2 tropospheric VCD products are on a 0.05 x 0.05 degree grid, spatially aggregated from the Level-2 data.
Included in the Level-3 data are tropospheric NO2 AMF, tropospheric NO2 VCD, AOD at 550 nm, SSA at 550 nm, and other ancillary parameters.
See user guide for brief documentation of the variables included (NO2 VCD, AMF, AOD, SSA, etc.), as well as how to read the Level-3 data.
Level-2 data
POMINO-TROPOMI v1.2 Level-2 Data Download (OneDrive) (Global user)
POMINO-TROPOMI v1.2 Level-2 Data Download (Quark) (China-based user)
See user guide for brief documentation of the variables included (NO2 VCD, AMF, AOD, SSA, etc.).
POMINO-TROPOMI v1.2.2 product
This product is added on 2023/01/25. Data are available from January 2021. Data before 2021 are the same as those in POMINO-TROPOMI v1.2 product. Updates will be done from time to time depending on manpower and requests.
POMINO-TROPOMI v1.2.2 monthly mean NO2 VCD maps in 2022/1-4-7-10/ (0.05 x 0.05 degree):

Level-3 data
POMINO-TROPOMI v1.2.2 Monthly or Daily Level-3 Data Download (OneDrive) (Global user)
POMINO-TROPOMI v1.2.2 Monthly or Daily Level-3 Data Download (Quark) (China-based user)
Both daily and monthly Level-3 NO2 tropospheric VCD products are on a 0.05 x 0.05 degree grid, spatially aggregated from the Level-2 data.
Included in the Level-3 data are tropospheric NO2 AMF, tropospheric NO2 VCD, AOD at 550 nm, SSA at 550 nm, and other ancillary parameters.
See user guide for brief documentation of the variables included (NO2 VCD, AMF, AOD, SSA, etc.), as well as how to read the Level-3 data.
Level-2 data
POMINO-TROPOMI v1.2.2 Level-2 Data Download (OneDrive) (Global user)
POMINO-TROPOMI v1.2.2 Level-2 Data Download (Quark) (China-based user)
See user guide for brief documentation of the variables included (NO2 VCD, AMF, AOD, SSA, etc.).
POMINO-TROPOMI v2 product
This product is added on 2023/10/25. Data are available since January 2023. Updates will be done from time to time depending on manpower and requests.
Level-3 data
POMINO-TROPOMI v2 Monthly or Daily Level-3 Data Download (OneDrive) (Global user)
POMINO-TROPOMI v2 Monthly or Daily Level-3 Data Download (Quark) (China-based user)
Both daily and monthly Level-3 NO2 tropospheric VCD products are on a 0.05 x 0.05 degree grid, spatially aggregated from the Level-2 data.
Included in the Level-3 data are tropospheric NO2 AMF, tropospheric NO2 VCD, AOD at 550 nm, SSA at 550 nm, and other ancillary parameters.
See user guide for brief documentation of the variables included (NO2 VCD, AMF, AOD, SSA, etc.), as well as how to read the Level-3 data.
Level-2 data
POMINO-TROPOMI v2 Level-2 Data Download (OneDrive) (Global user)
POMINO-TROPOMI v2 Level-2 Data Download (Quark) (China-based user)
See user guide for brief documentation of the variables included (NO2 VCD, AMF, AOD, SSA, etc.).
References
Lin, J.-T. *, R. V. Martin, K. F. Boersma, M. Sneep, P. Stammes, R. Spurr, P. Wang, M. Van Roozendael, K. Clémer, and H. Irie: Retrieving tropospheric nitrogen dioxide from the Ozone Monitoring Instrument: Effects of aerosols, surface reflectance anisotropy, and vertical profile of nitrogen dioxide, Atmos. Chem. Phys., 14, 1441-1461, doi:10.5194/acp-14-1441-2014, 2014 (PDF) (Original algorithm: proof of concept)
Lin, J.-T. *, Liu, M.-Y., Xin, J.-Y., Boersma, K. F., Spurr, R., Martin, R., and Zhang, Q.: Influence of aerosols and surface reflectance on satellite NO2 retrieval: seasonal and spatial characteristics and implications for NOx emission constraints, Atmospheric Chemistry and Physics, 15, 11217-11241, doi:10.5194/acp-15-11217-2015, 2015 (PDF) (Supplement) (Original algorithm and POMINO v1 product)
Liu, M.-Y., Lin, J.-T. * , Boersma, K. F. *, Pinardi, G., Wang, Y., Chimot, J., Wagner, T., Xie, P., Eskes, H., Van Roozendael, M., Hendrick, F., Wang, P., Wang, T., Yan, Y.-Y., Chen, L.-L., and Ni, R.-J.: Improved aerosol correction for OMI tropospheric NO2 retrieval over East Asia: constraint from CALIOP aerosol vertical profile, Atmospheric Measurement Techniques, 12, 1-21, doi:10.5194/amt-12-1-2019, 2019 (PDF) (Updated algorithm and POMINO v1.1 and v2 products)
Liu, M.-Y., Lin, J.-T. *, Kong, H., Boersma, K. F., Eskes, H., Kanaya, Y., He, Q., Tian, X., Qin, K., Xie, P., Spurr, R., Ni, R.-J., Yan, Y.-Y., Weng, H.-J., and Wang, J.-X.: A new TROPOMI product for tropospheric NO2 columns over East Asia with explicit aerosol corrections, Atmospheric Measurement Techniques, 13, 4247-4259, doi:10.5194/amt-13-4247-2020, 2020 (PDF) (Supplement) (POMINO-TROPOMI algorithm and v1 product)
Introduction
The POMINO-GEMS product is developed based on the Geostationary Environment Monitoring Spectrometer (GEMS) launched in February 2020. The retrieval domain is 70°-140°E, 15°-55°N. Currently, we provide POMINO-GEMS v1.0.0 dataset.
The GEMS instrument is on board the GK-2B satellite locating at 128.2°E over the equator. The nominal spatial resolution is typically 7 km x 8 km for gases and 3.5 km x 8 km for aerosols in the eastern and central scan domains. The whole field of view (FOV) is latitudes from 5°S to 45°N and longitudes from 80°E to 152°E. The number of hourly GEMS observations per day varies from 6 in winter to 10 in summer, corresponding to the annual movement of subsolar points relative to the Earth.
Algorithm
POMINO-GEMS v1 (Zhang et al., 2023):
The algorithm to retrieve tropospheric NO2 from GEMS measurement is developed based upon our previous POMINO-OMI retrieval algorithm. First, we derive hourly tropospheric NO2 slant column densities (SCDs) by exploiting GEMS v1.0, TROPOMI PAL v2.3.1 and GEOS-CF datasets; then we use online parallelized LIDORT-driven AMFv6 package to calculate hourly tropospheric NO2 air mass factors (AMFs). The flow chart below shows the retrieval algorithm in detail.
First, we combine GEMS v1.0 and TROPOMI PAL v2.3.1 products to obtain hourly 0.05° x 0.05° corrected total NO2 SCDs for each day. Second, we calculate hourly stratospheric NO2 VCDs by using stratospheric NO2 data from TROPOMI PAL v2.3.1 and GEOS-CF products, which are converted to stratospheric NO2 SCDs using GEMS observation geometry and then are removed to get tropospheric NO2 SCDs.
In the calculation for hourly tropospheric NO2 AMFs, we explicitly consider the dependence of surface reflectance on the light geometry (BRDF), explicitly account for the aerosol scattering/absorbing effects, and use a priori NO2 vertical profiles with relatively high spatial resolution. Since cloud properties are prerequisite for NO2 retrieval, we re-retrieve cloud fraction and cloud pressure based on the O2-O2 algorithm using consistent ancillary parameters before NO2 AMF calculation.
The detailed description of our algorithm and validation of our product can be found in Zhang et al. (2023).

Figure 1. Flow chart of POMINO-GEMS retrieval algorithm.
POMINO-GEMS v1 product
This product is added on 2023/10/08. Data are available since December 2020.
POMINO-GEMS v1 seasonal mean hourly NO2 VCD maps in June-July-August 2021 (0.05 x 0.05 degree):

Level-3 data
1.From 2020/12 to 2021/02
POMINO-GEMS v1 Monthly or Daily Level-3 Data Download (OneDrive) (Global user)
POMINO-GEMS v1 Monthly or Daily Level-3 Data Download (Quark) (China-based user)
2.Since 2021/03
POMINO-GEMS v1 Monthly or Daily Level-3 Data Download (OneDrive) (Global user)
POMINO-GEMS v1 Monthly or Daily Level-3 Data Download (Quark) (China-based user)
Both daily and monthly Level-3 NO2 tropospheric VCD products are on a 0.05 x 0.05 degree grid, spatially aggregated from the Level-2 data.
Included in the Level-3 data are tropospheric NO2 AMF, tropospheric NO2 VCD, AOD at 550 nm, SSA at 550 nm, and other ancillary parameters.
See user guide for brief documentation of the variables included (NO2 VCD, AMF, AOD, SSA, etc.), as well as how to read the Level-3 data.
Level-2 data
1.From 2020/12 to 2021/02
POMINO-GEMS v1 Level-2 Data Download (OneDrive) (Global user)
POMINO-GEMS v1 Level-2 Data Download (Quark) (China-based user)
2.Since 2021/03
POMINO-GEMS v1 Level-2 Data Download (OneDrive) (Global user)
POMINO-GEMS v1 Level-2 Data Download (Quark) (China-based user)
See user guide for brief documentation of the variables included (NO2 VCD, AMF, AOD, SSA, etc.).
References
Lin, J.-T. *, R. V. Martin, K. F. Boersma, M. Sneep, P. Stammes, R. Spurr, P. Wang, M. Van Roozendael, K. Clémer, and H. Irie: Retrieving tropospheric nitrogen dioxide from the Ozone Monitoring Instrument: Effects of aerosols, surface reflectance anisotropy, and vertical profile of nitrogen dioxide, Atmos. Chem. Phys., 14, 1441-1461, doi:10.5194/acp-14-1441-2014, 2014 (PDF) (Original algorithm: proof of concept)
Lin, J.-T. *, Liu, M.-Y., Xin, J.-Y., Boersma, K. F., Spurr, R., Martin, R., and Zhang, Q.: Influence of aerosols and surface reflectance on satellite NO2 retrieval: seasonal and spatial characteristics and implications for NOx emission constraints, Atmospheric Chemistry and Physics, 15, 11217-11241, doi:10.5194/acp-15-11217-2015, 2015 (PDF) (Supplement) (Original algorithm and POMINO v1 product)
Liu, M.-Y., Lin, J.-T. * , Boersma, K. F. *, Pinardi, G., Wang, Y., Chimot, J., Wagner, T., Xie, P., Eskes, H., Van Roozendael, M., Hendrick, F., Wang, P., Wang, T., Yan, Y.-Y., Chen, L.-L., and Ni, R.-J.: Improved aerosol correction for OMI tropospheric NO2 retrieval over East Asia: constraint from CALIOP aerosol vertical profile, Atmospheric Measurement Techniques, 12, 1-21, doi:10.5194/amt-12-1-2019, 2019 (PDF) (Updated algorithm and POMINO v1.1 and v2 products)
Zhang, Y.-H., Lin, J.-T. *, Liu, M.-Y., Kong, H., Chen, L.-L., Weng, H.-J., and Li, C.-J.: High-resolution tropospheric NO2 Retrieval over Asia based on OMI POMINO v2.1 and quantitative comparison with other products (in Chinese), National Remote Sensing Bulletin, 26, 971-987, doi:10.11834/jrs.20221413, 2022 (PDF) (Supplement)
Zhang, Y.-H., Lin, J.-T. *, Kim, J., Lee, H., Park, J., Hong, H., Van Roozendael, M., Hendrick, F., Wang, T., Wang, P.-C., He, Q., Qin, K., Choi, Y., Kanaya, Y., Xu, J., Xie, P.-H., Tian, X., Zhang, S.-B., Wang, S.-S., Cheng, S.-Y., Cheng, X.-H., Ma, J.-Z., Wagner, T., Spurr, R., Chen, L.-L., Kong, H., and Liu, M.-Y.: A research product for tropospheric NO2 columns from Geostationary Environment Monitoring Spectrometer based on Peking University OMI NO2 algorithm, Atmospheric Measurement Techniques, doi:10.5194/amt-16-4643-2023, 2023 (PDF) (Supplement) (POMINO-GEMS algorithm and v1 product)
PKUCPL: A Two-Way Coupler to integrating models
We develop a PKUCPL (PeKing University CouPLer) coupler to integrating multiple models in a manner of two-way coupling, i.e., allowing for feedbacks between models.
The idea of developing PKUCPL originated from the fact that current global simulations tend to overestimate the global tropospheric oxidative capacity.
Global chemical transport models, widely used for studying global air pollution and transport, are limited by coarse horizontal resolutions, not allowing for detailed representation of small-scale nonlinear processes over the pollutant source regions. Traditional one-way nested regional models take global model outputs as lateral boundary conditions without feeding back to the global model, and thus do not affect the simulated global atmospheric environment. Global simulations at coarse resolutions typically overestimate the tropospheric oxidative capacity, i.e., with an overestimate in OH and ozone concentrations, and an underestimate in CO concentration, MCF lifetime and CH4 lifetime.
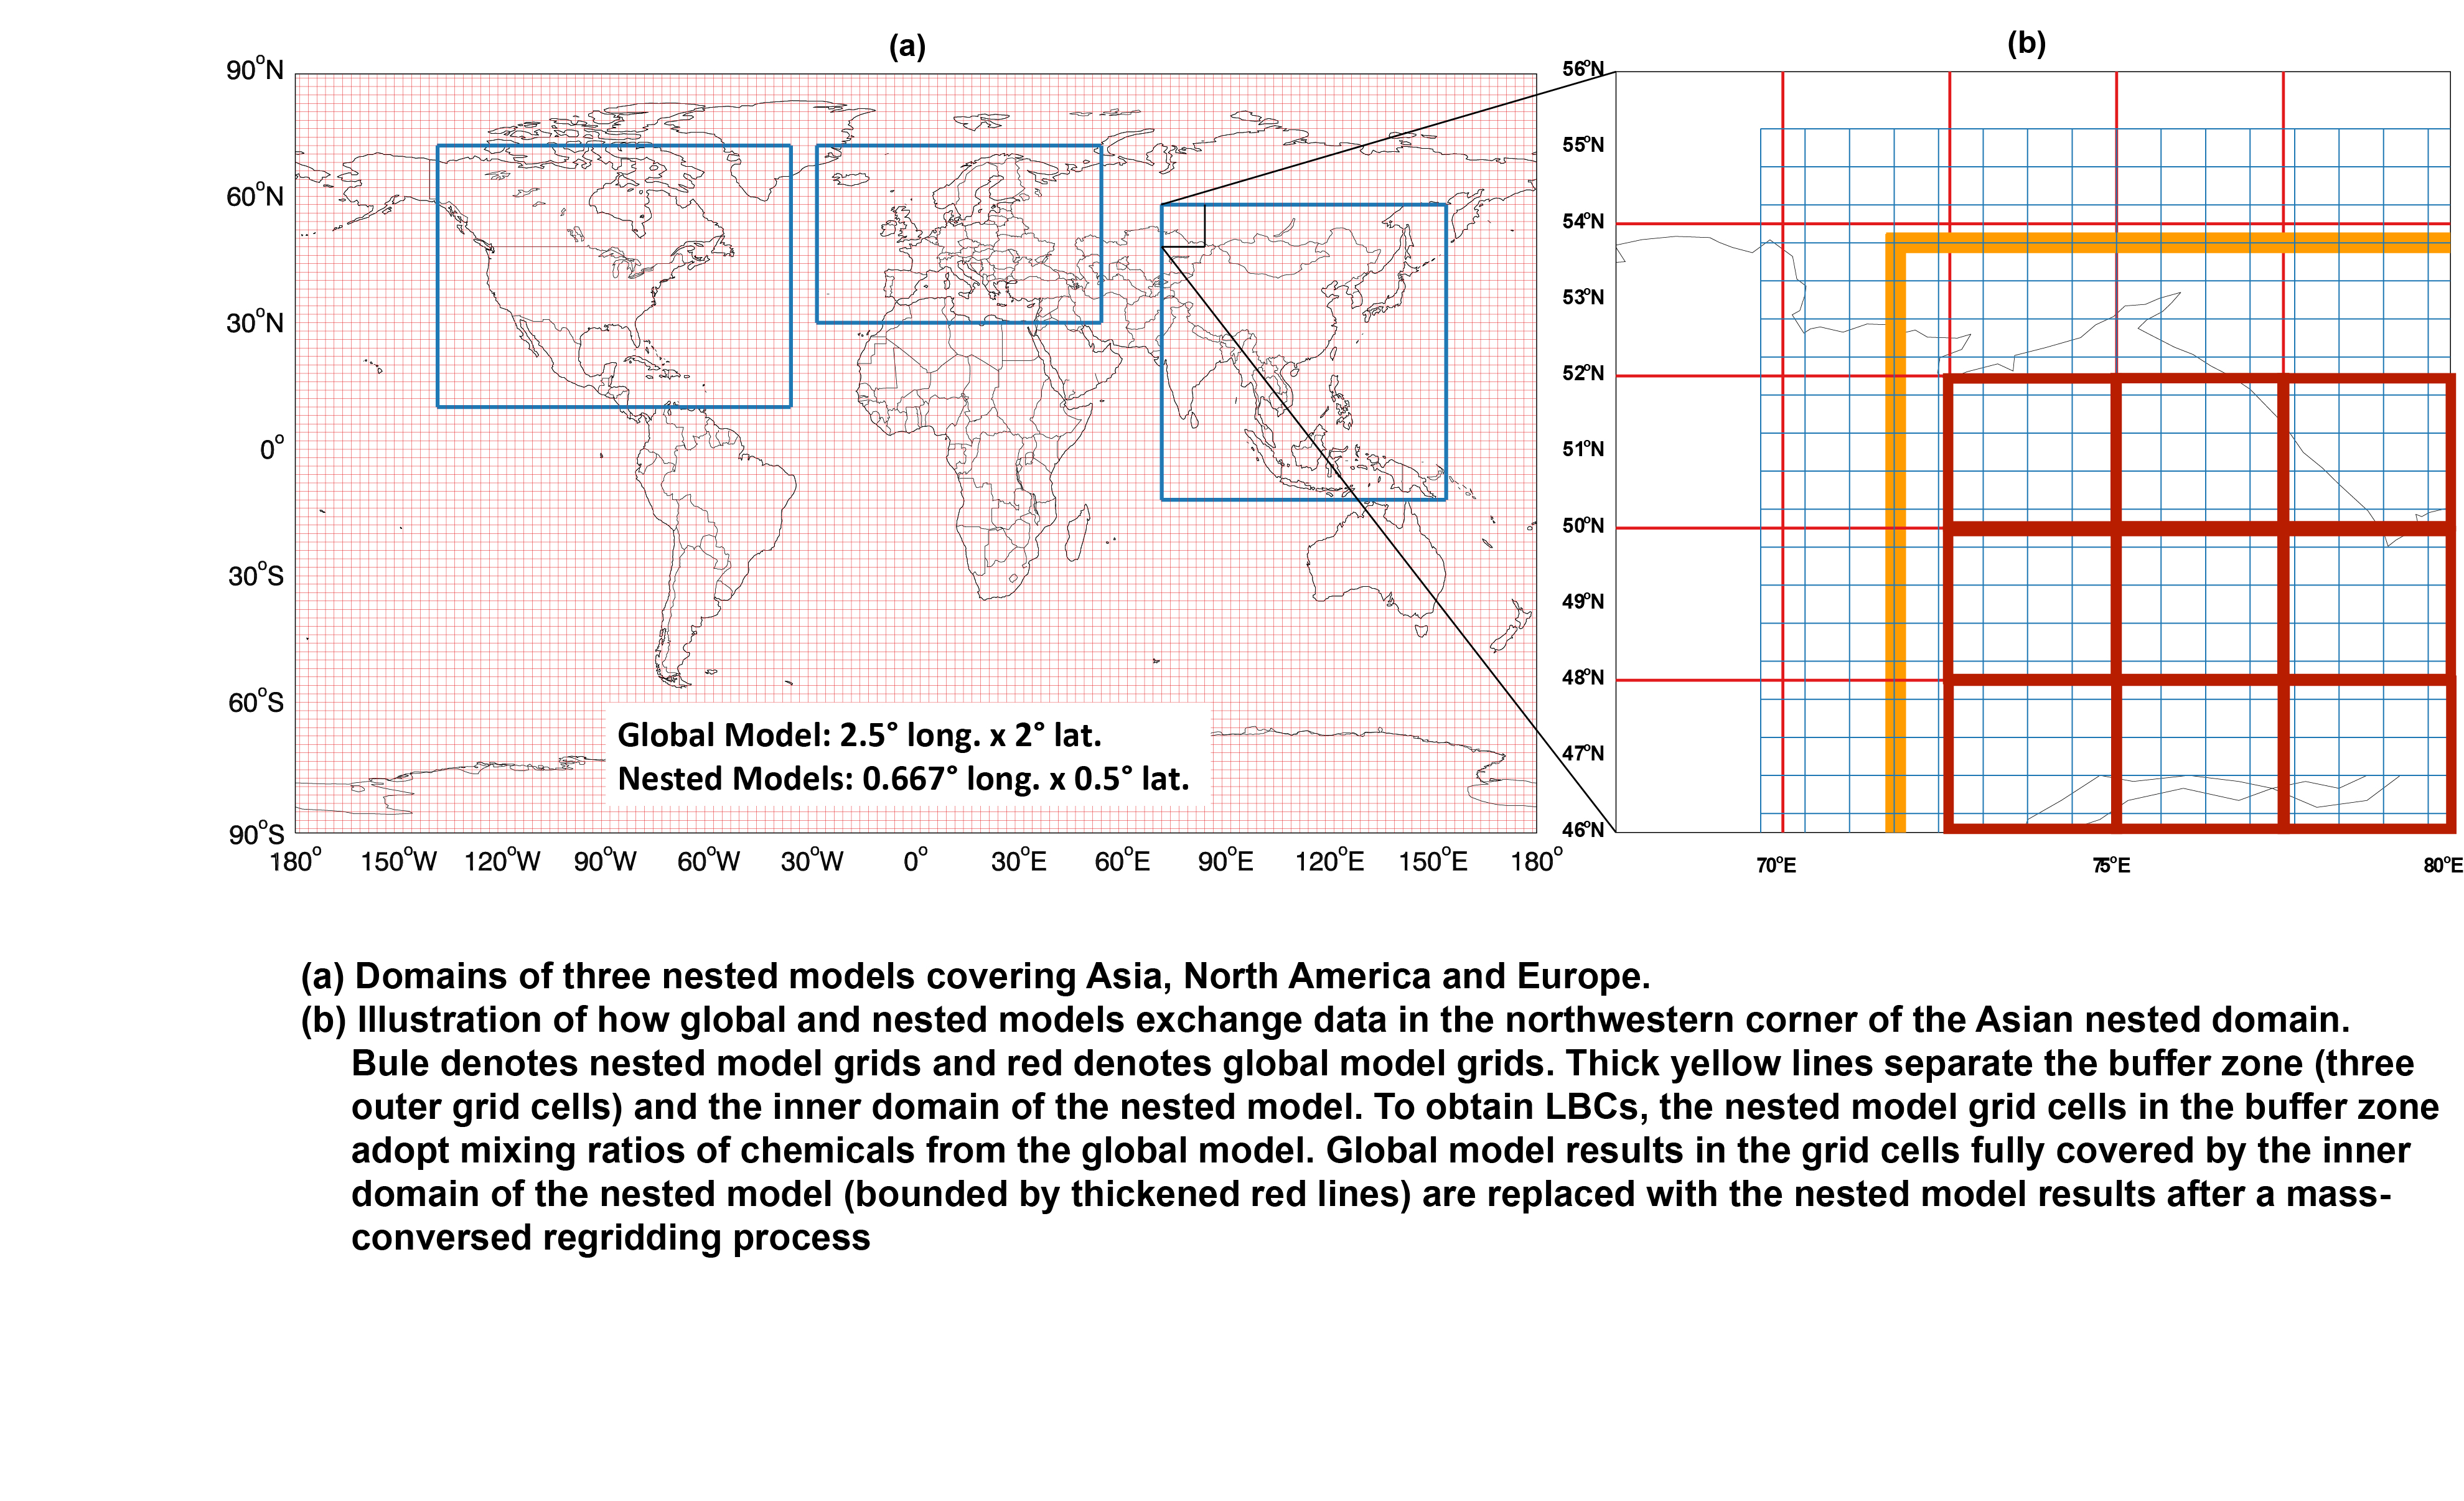
We develop and use PKUCPL to integrate, in a manner of two-way coupling, the global GEOS-Chem CTM (at ~2 degree resolution) and its multiple nested models (at 0.5 or 0.25 degree resolutions) covering Asia, North America and Europe. As an example, see the coupling regions and the coupling flowchart here for global + three nested models.
Effects of two-way coupling between global and nested models of GEOS-Chem
Under the two-way coupling framework, PKUCPL takes global model results as lateral boundary conditions of nested models, and at the same time takes nested model results, conduct a regridding procedure, and replaces the global model results within the nested model domains. This allows for feedback between global and nested models. Thus, the two-way coupling allows smaller-scale nonlinear processes in the nested domains (which are normally major pollution source regions) to be better represented and be able to affect the large-scale atmospheric chemistry across the globe.
As a result, the two-way coupling improves the simulations of both regional chemistry and global transport. In particular, the two-way coupling significantly alleviates the overestimate of the tropospheric oxidative capacity in the global simulation, with large reductions in OH and ozone concentrations and enhancements in CO concentration, MCF lifetime and CH4 lifetime (Yan et al., 2014; Yan et al., 2016).
In Yan et al. (2014):
1. We use CO as a tracer to diagnose the consequence of the two-way coupling (Difference between a two-way coupled and a 'pure' global simulation: An animation from 2008.07.01 to 2008.08.15). Compared to a pure global model, the two-way coupled simulation increases the global tropospheric mean CO concentration in 2009 by 10.4%, with a greater enhancement at 13.3% in the Northern Hemisphere. Correspondingly, the global tropospheric mean hydroxyl radical (OH) is reduced by 4.2%, resulting in a 4.2% enhancement in the methyl chloroform lifetime. (See the global budget of tropospheric OH for 2009 here.) The resulting CO and OH contents and MCF lifetime are closer to observation-based estimates.
2. Various factors differentiate the two-way coupled model from the global model, including the small-scale variability of NOx, CO and VOC, the resolution- and meteorology-dependent natural emissions, and other nonlinear small-scale processes. See the percentage contributions of individual factors to the difference in January 2009 tropospheric CO between the two-way coupled model and the global model.
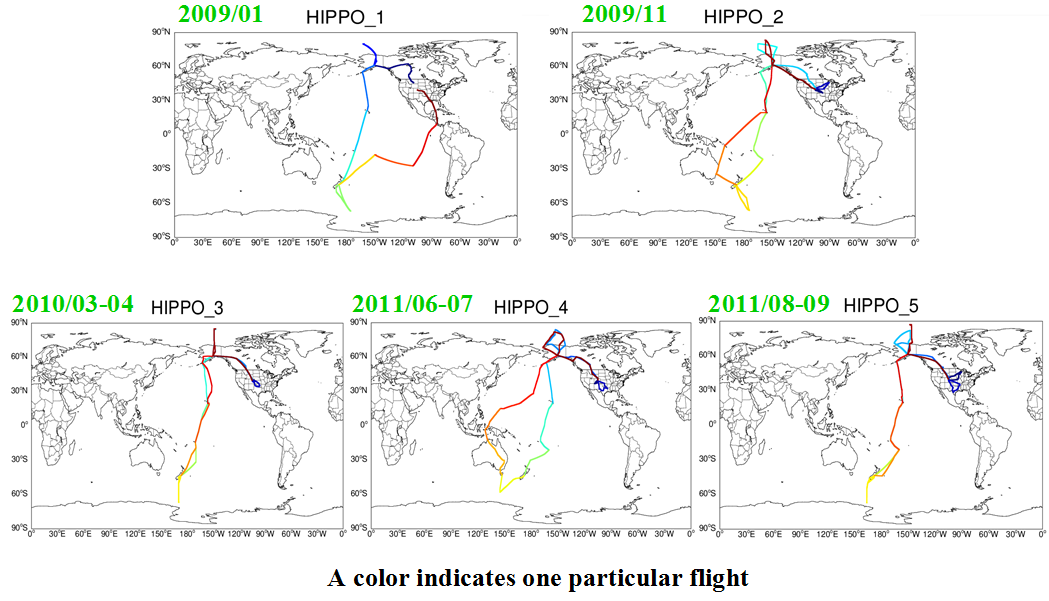
3. Comparisons with the tropospheric CO measurements over the Pacific Ocean during the HIPPO campaigns (Flight tracks and times) in various seasons between 2009 and 2011 show significant improvements by the two-way coupled simulation on the magnitude and spatiotemporal variability of CO. In particular, the two-way coupled simulation captures the measured vertical profiles of CO, with a mean bias of 1.1 ppb (1.4%) below 9 km compared to the bias at -7.2 ppb (-9.2%) for the global model alone. See the CO time-height distribution across five HIPPO campaigns and the CO vertical profiles in five individual HIPPO campaigns.
4. The two-way coupling also affects simulations of other species. See our preliminary results for 2009: Global tropospheric hydrophobic BC, Global tropospheric hydrophilic BC, Global tropospheric OH, Global tropospheric O3.
In Yan et al. (2016):
We focus on the year of 2009. The simulated global tropospheric mean OH concentration is reduced by 5% and the MCF and CH4 lifetimes are increased by 5%. The global tropospheric ozone mass is reduced by 10%, and the global CO mass is increased by 10%. All these changes help reduce positive/negative biases in the simulation of these variables.
PKUCPL Code applied to GEOS-Chem
PKUCPL has been adopted in GEOS-Chem stanadard model since version 10.
Users can choose to couple the global model with any numbers of nested models, with a straightforward setup.
Users can choose various resolutions for global (e.g., 2.5 long. x 2 lon., 5 long. x 4 lat.) or regional (e.g., 0.667 long. x 0.5 lat., 0.3125 long. x 0.25 lat.) models.
The computational complexity of two-way coupling is minimized by the PKUCPL coupler. Users can learn how to set up a two-way coupled simulation quickly (i.e., within 1-2 hours), following a simple manual. Individual global/nested models can run at different nodes, as desired.
The computational time of the coupled system is determined by and is comparable to that of the slowest individual model. Our test suggests that only 2% or so additional run time is needed beyond the slowest individual model (the nested model for North America).
For more details, see this wiki page.
PKUCPL for integrating other models
PKUCPL is available for public use. It is flexible and can be modified and applied to other types of models (e.g., between chemistry models and climate/meteorological models or between atmospheric and oceanic models of various complexities). Please contact us for collaborations.
References
Yan, Y.-Y., Lin, J.-T. *, Kuang, Y., Yang, D.-W., and Zhang, L.: Tropospheric carbon monoxide over the Pacific during HIPPO: Two-way coupled simulation of GEOS-Chem and its multiple nested models, Atmospheric Chemistry and Physics, 14, 12649-12663, doi:10.5194/acp-14-12649-2014, 2014 (PDF)
Yan, Y.-Y., Lin, J.-T. *, Chen, J., and Hu, L.: Improved simulation of tropospheric ozone by a global-multi-regional two-way coupling model system, Atmospheric Chemistry and Physics, 16, 2381-2400, doi:10.5194/acp-16-2381-2016, 2016 (PDF)
Why are visibility data useful for aerosol inference?
Multi-decadal aerosol data are necessary to understand how aerosols affect climate and climate changes on the regional and global scales. However, high-quality satellite- or ground-based aerosol measurements are not available for such long-term studies. Surface visibility measurements at thousands of stations worldwide can provide useful information for long-term aerosol inference, complementing satellite- and ground-based measurements. Here we combine visibility measurements and a chemical transport model simulation to derive a new gridded AOD dataset, by converting near surface station-specific visibility data to gridded AOD data.
Method to converting from station-specific visibility data to gridded AOD data
Step 1: Near surface Aerosol Extinction Coefficient (AEC) is calculated from a quality-controlled 3-hourly visibility measurement in the absence of precipitation and fogs.
Step 2: A temporally and spatially coincident AOD to AEC ratio modeled by GEOS-Chem is used to convert near surface AEC to column AOD. In this way, the knowledge of model aerosol profile is involved, instead of assuming a uniform exponential vertical distribution as in many preivous studies.
Step 3: The visibility converted and GEOS-Chem simulated AOD to produce a new “merged” AOD dataset on a longitude-latitude grid (current resolution is 0.667º long. × 0.5º lat.). For each day, we find for a given grid cell all stations within a 2º radius of the grid cell center, calculate the ratios of visibility converted over GEOS-Chem AOD, and then use the median value of the ratios to scale the modeled AOD at the grid cell.
Product and validation
The visibility-model merged gridded AOD data are obtained. The new data preserve the spatial distribution of model AOD while using the visibility measurements to correct for the model bias.
The merged AOD dataset is highly consistent with AOD data from MODIS, AERONET, CARSNET and CSHNET, with a low bias (< 0.05 over East China) and high spatial and temporal (diurnal, seasonal and interannual) correlation.
Data
Monthly data are currently available for 2004/10 through 2013/04 over East China (101.25ºE–126.25ºE, 19ºN–46ºN), and are free for non-commercial use.
Data resolution: 0.667 longitude x 0.5 latitude degree.
Animation of monthly mean visibility-model merged AOD maps: 2004/10-2013/04

Data Download
Visibility-model merged monthly mean AOD data download. Please see the "readme" file inside for how to read the binary data.
Adjusted visibility-model merged monthly mean AOD data download. For comparison with monthly mean MODIS/Aqua AOD, we also provide monthly mean data adjusted based on the difference in days with valid MODIS data versus with valid visibiilty data. See our paper below for details. Please see the "readme" file inside for how to read the binary data.
References
Lin, J.-T. *, and Li, J.: Spatio-temporal variability of aerosols over East China inferred by merged visibility-GEOS-Chem aerosol optical depth, Atmospheric Environment, 132, 111-122, doi:10.1016/j.atmosenv.2016.02.037, 2016 (PDF)
Lin, J.-T. *, van Donkelaar, A., Xin, J., Che, H., and Wang, Y.: Clear-sky aerosol optical depth over East China estimated from visibility measurements and chemical transport modeling, Atmospheric Environment, 95, 257-267, doi:10.1016/j.atmosenv.2014.06.044, 2014 (PDF)
Brief Introduction
Many variables of interest, such as air pollutants and meteorological parameters, often exhibit complex spatial and temporal variabilities. In particular, these variables contain many temporal scales that are non-periodic and non-stationary, challenging proper quantitative characterization and visualization.
The EOF-EEMD analysis-visualization package we complied aims to evaluate the spatiotemporal variability across scales, which can be periodic/stationary or not. As shown in the figure below, the package consists, in order, of an EOF analysis (Lorenz, 1956), an EEMD analysis (Wu et al., 2009), a Hilbert-Huang Transform (HT) with Marginal Spectrum Analysis (MSA), and a visualization step to quantitatively depict the spatial-temporal scales of measurement or model data.

Figure. The flow chart of EOF-EEMD analysis-visualization package. The red boxes represent quantities visualized. Source: Liu et al. (2018).
Download EOF-EEMD
See here (including user guide, a full IDL version, and a partial MATLAB version)
Note that parts of the codes are adopted from Zhaohua Wu in MATLAB, and parts are modified from Jinxuan Chen and May Fu's codes. See user guide for detailed credit descriptions.
References
Liu, M.-Y., Lin, J.-T. *, Wang, Y.-C., Sun, Y., Zheng, B., Shao, J., Chen, L.-L., Zheng, Y., Chen, J., Fu, M., Yan, Y.-Y., Zhang, Q., and Wu, Z.: Spatiotemporal variability of NO2 and PM2.5 over Eastern China: observational and model analyses with a novel statistical method, Atmospheric Chemistry and Physics, 18, 1–20, doi:10.5194/acp-18-1-2018, 2018 (PDF) (Supplement)
Wu, Z., Huang, N. E., and Chen, X.: The Multi-Dimensional Ensemble Empirical Mode Decomposition Method, Adv. Adapt. Data Anal., 1, 339–372, https://doi.org/10.1142/S1793536909000187, 2009
Lorenz, E. N.: Empirical Orthogonal Functions and Statistical Weather Prediction, Dep. Meteorol. MIT, 1(Statistical Forecasting Project;Scientific Report No. 1), 49, 1956
Brief Introduction
Natural emissions of air pollutants from the surface play major roles in air quality and climate change. In particular, nitrogen oxides (NOx) emitted from soils contribute ~15% of global NOx emissions, sea salt aerosols are a major player in the climate and chemistry of the marine atmosphere, and biogenic emissions of volatile organic compounds (VOCs) are the dominant source of VOCs at the global scale.
We use Harvard-NASA Emissions Component (HEMCO; http://wiki.seas.harvard.edu/geos-chem/index.php/HEMCO) to produce hourly global emissions of soil NOx, SSAs, and BVOCs at different resolutions.
These emissions are calculated at 0.5° lat. x 0.625° lon. for 1980—2017 using MERRA-2 assimilated meteorology and at three resolutions (0.25° lat. x 0.3125° lon., 2° lat. x 2.5° lon., and 4° lat. x 5° lon.) for 2014—2017 using GEOS-FP.
Our long-term high-resolution emission datasets offer useful information to study natural pollution sources and their impacts on air quality, climate, and carbon cycle.

Table 1. Global annual total emissions of soil NOx, SSAs, and BVOCs (with standard deviation) over 1980–2017 derived based on MERRA-2 at 0.5° lat. × 0.625° lon.
We also offer the respective emissions at lower resolutions, which can be used to evaluate the impacts of resolution on estimated global and regional emissions.

Table 2. Global annual total emissions of soil NOx, SSAs, and BVOCs over 2014–2017 derived based on GEOS-FP at three resolutions. The percentage values represent the relative changes from emissions at 4° lat. × 5° lon.
Soil NOx
Spatial distribution of monthly soil NOx emission over 1980—2017 derived based on MERRA-2 at 0.5° lat. × 0.625° lon.

SSAs
Spatial distribution of monthly SSAs emission (sum of SALA and SALC) over 1980—2017 derived based on MERRA-2 at 0.5° lat. × 0.625° lon. Sea salt aerosols emission considers two categories of SSAs based on their radii. The radius of accumulation mode sea salt aerosol (SALA) ranges from 0.01 to 0.5 μm, while that for coarse mode sea salt aerosol (SALC) ranges from 0.5 to 8 μm.

Biogenic VOCs
Spatial distribution of monthly total BOVCs (sum of all species) over 1980—2017 derived based on MERRA-2 at 0.5° lat. × 0.625° lon. Our BVOCs emission includes isoprene (the most abundant species), acetone (ACET), acetaldehyde (ALD2), ethane (C2H4), ethanol (EOH), propene (PRPE), lumped monoterpenes (MTPA), other monoterpenes (MTPO), limonene (LIMO), and sesquiterpenes (SESQ).

Data
Monthly
Hourly
Code
References
Weng, H.-J., Lin, J.-T. *, Martin, R., Millet, D. B., Jaeglé, L., Ridley, D., Keller, C., Li, C., Du, M.-X., and Meng, J.: Global high-resolution emissions of soil NOx, sea salt aerosols, and biogenic volatile organic compounds, Scientific Data, 7, 148, doi:10.1038/s41597-020-0488-5, 2020 (PDF) (data download)
Brief Introduction
PM2.5 chemical components influence air pollution, climate change, and public health. However, there is absence of publicly available observational component data over China. Here we compile a PM2.5 component dataset based on observational organic carbon, black carbon, sulfate, nitrate and ammonium concentrations since 2000 over China collected from the literature.
The publicly downloadable dataset includes seasonal and annual mean observational concentrations between 2000 and 2014, including 2469 component records nationwide. Here a record represents one measured PM2.5 component at the specific sample site and period. These records cover 30 provinces (including provinces and provincial-level municipalities) and multiple land use types (urban, rural, near the road, and industrial park, etc.).
Other observational component data, such as more detailed data or data during 2014–2021, are available on a collaborative basis (Email: renfx@stu.pku.edu.cn; linjt@pku.edu.cn).
Keyword
PM2.5 components, organic carbon, black carbon, sulfate, nitrate, ammonium, observational concentrations
Download Link
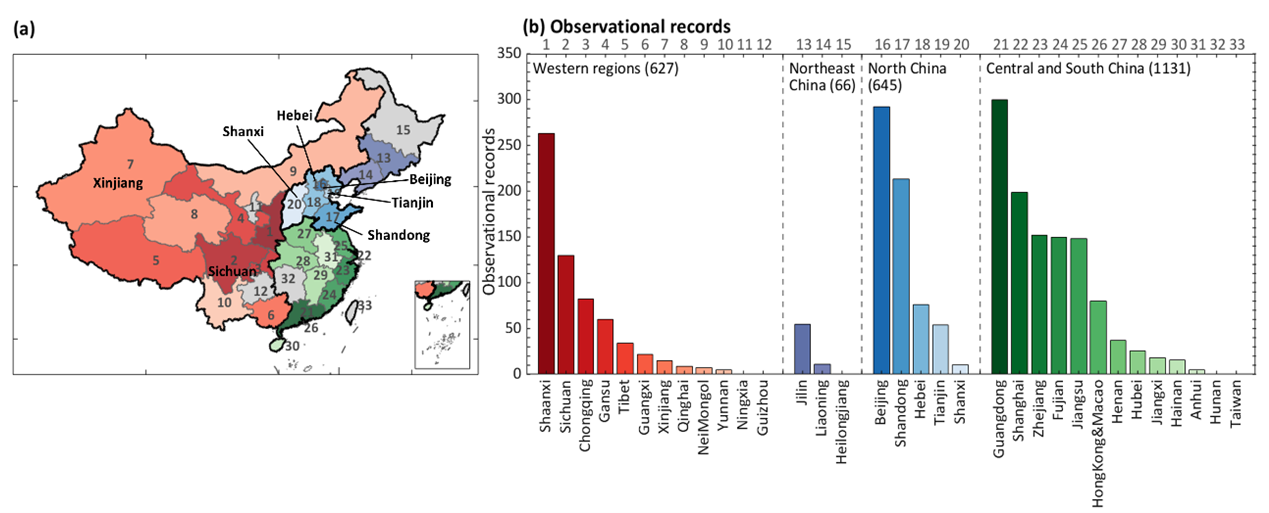
Figure 1. Observational records of PM2.5 components during 2000–2014 collected from the literature. (a) The map depicts individual provinces in four regions, including the western regions in red colors, Northeast China in purple, North China in blue, and Central and South China in green. The provinces without observational records are in gray. The number denotes each province. (b) Provincial observation records in China. The number on the upper x axis and the color in each bar match the province in panel (a).
Temporal Range
2000-2014, seasonal and annual mean data. Data for 2015-2021 are available on a collaborative basis.
Spatial Range
China
References
Ren, F.-X., Lin, J.-T. *, Xu, C.-H., Adeniran, J. A., Wang, J., Martin, R. V., van Donkelaar, A., Hammer, M., Horowitz, L., Turnock, S. T., Oshima, N., Zhang, J., Bauer, S., Tsigaridis, K., Seland, Ø., Nabat, P., Neubauer, D., Strand, G., van Noije, T., Le Sager, P., and Takemura, T.: Evaluation of CMIP6 model simulations of PM2.5 and its components over China, Geoscientific Model Development, 17, 4821–4836, doi:10.5194/gmd-17-4821-2024, 2024 (PDF) (Supplement1) (Supplement2) (Link)
This page was last modified at July 23, 2024, 2:46 a.m. (UTC). This page has been accessed 42667 times
Copyright © Jintai Lin 2015. All rights reserved.